“Integrating Knowledge Graphs for Comparing the Scientific Output of Academia and Industry” is a poster paper submitted to the poster and demo session of the International Semantic Web Conference, October 26 – 30, 2019 The University of Auckland, New Zealand.
Simone Angioni1, Francesco Osborne2, Angelo A. Salatino2, Diego Reforgiato Recupero1, Enrico Motta2
1 University of Cagliari, Via Università 40, 09124 Cagliari
2 Knowledge Media Institute, The Open University, MK7 6AA, Milton Keynes, UK
Abstract
Analysing the relationship between academia and industry allows us to understand how the knowledge produced by the universities is being adopted and enriched by the industrial sector, and ultimately affects society through the release of relevant products and services. In this paper, we present a preliminary approach to assess and compare the research outputs of academia and industry. This solution integrates data from several knowledge graphs describing scientific articles (Microsoft Academics Graph), research topics (Computer Science Ontology), organizations (Global Research Identifier Database), and types of industry (DBpedia). We focus on the Semantic Web as exemplary field and report several insights regarding the different behaviours of academia and industry, and the types of industries most active in this field.
1 Introduction
Analysing the relationship between academia and industry allows us to understand how the knowledge produced by the universities is adopted and enriched by the industrial sector, and ultimately affects society through the release of relevant products and services. Academia and industry influence each other in a variety of ways, usually through the exchange of ideas, resources, and influence [1]. This complex scenario has been analysed from several perspectives in the literature, e.g., focusing on the characteristics of direct collaborations [2], on the influence of industrial trends on curricula [3], and on the quality of the knowledge transfer [4]. Governments and funding councils typically aim to harmonise academia and industry efforts and support collaborative initiatives. However, we still lack good quantitative tools for monitoring and studying this crucial relationship.
In this poster paper, we present a preliminary approach to automatically analyse research articles and compare the scientific outputs of academia and industry. Our objective is to generate a knowledge graph that could support several kinds of analyses aimed at determining to what degree commercial trends affect academia, assessing which academic innovations may be adopted by industry and in which timeframe, identifying academic topics that are not addressed by industry and the other way around, and so on. The preliminary approach presented in this paper integrates data from several knowledge graphs describing scientific articles (Microsoft Academics Graph), research topics (Computer Science Ontology), organizations (Global Research Identifier Database), and types of industry (DBpedia). It then classifies the papers in three categories: academia, industry, and “collaborative efforts”. The papers produced by industrial affiliations are also segmented according to a variety of more granular types derived from DBpedia (e.g, Computing and IT, Telecommunications, Health Care). The results are visualized in a dashboard which offers several analytics on the evolution of the scientific output over the years. In this paper, we focus on the Semantic Web as exemplary field and report several insights regarding the behaviour of academia and industry and the kinds of industries most active in this discipline. However, the approach is general and can be easily applied to other research areas as well.
2 Knowledge Graph Integration
In order to study the academic output of academia and industry in different research fields, we need a knowledge base describing categories and topics of research papers and characterising each affiliation according to its type. Since we lack a similar knowledge base, we developed a pipeline for generating a knowledge graph that integrates four sources of complementary information:
- Microsoft Academic Graph (MAG, https://academic.microsoft.com), a knowledge graph describing over 300 million scientific publications associated with metadata such as title, abstract, authors, institution, venues, and fields of study.
- Global Research Identifier Database (GRID, https://www.grid.ac/), an open database that describes over 90K organizations active in research.
- DBpedia (https://wiki.dbpedia.org/), the well-known knowledge base containing information created in the Wikipedia project, describing more than 6 million entities including 275K organizations.
- Computer Science Ontology (CSO, https://cso.kmi.open.ac.uk/), the largest taxonomy of research areas in the field, including 14K research topics and 162K semantic relationships.
Since we wanted to focus on the field of Computer Science, we first selected a subset of MAG containing 14 million publications which have “Computer Science” as field of study. To classify these papers according to the types of organizations producing them, we extracted the list of their affiliations, and retrieved their types from GRID (e.g., “Education”, “Government”, “Company”, “Nonprofit”). We classified a paper as “academia” (A) when all its affiliations were of type “Education”, as “industry” (I) when they were of type “Company”, and as “collaborative effort” (C) when they had at least one affiliation of type “Education” and another one of type “Company”. Since it is useful to segment the companies according to their focus, we queried DBpedia and extracted for each industrial affiliation the objects of the properties “About:Purpose” and “About:Industry”. This resulted in a noisy and redundant sets of 240 types. We then clustered together similar ones and produced a more feasible set of 47 high-level types. For instance, the type “Health Care” in the resulting knowledge graph was derived by several types obtained from DBpedia such as “Pharmaceutical company”, “Clinical research organization”, and “Medical equipment”.
Since the “fields of study” in MAG are too coarse-grained for the purpose of our analysis, we also annotated each paper with the research topics of CSO. To this purpose, we used the CSO Classifier [5], which is an unsupervised approach that identifies promising terms with part-of-speech tagging and then exploits word embeddings to extract a set of topics relevant to a document. We ran the CSO classifier on the title and abstract of all the publications in the dataset and enriched the resulting set of topics by including also all their super-topics. For instance, papers tagged with “Deep Learning”, were also tagged with “Machine Learning”, “Artificial Intelligence”, and “Computer Science”.
The resulting knowledge graph includes about 2.9 million research publications (2.2M of type A, 607K of type I, and 91K of type C) and 11,872 affiliations, including 1,077 companies. The most frequent company types in this dataset are Computing and IT (15%), Health Care (14%), Electronics (9%), Automotive (8%), Telecommunications (8%), and Oil and Gas (6%). In order to analyse the knowledge graph, we loaded it on an Elasticsearch instance and developed a simple dashboard with Dash (https://dash.plot.ly/). This interface enables us to focus on a subset of publications by filtering them according to a variety of facets (e.g., topics, venues, countries) and producing analytics regarding the distribution of A, I, and C publications over the years.
3 Preliminary Analysis in the Field of Semantic Web
We report as an example a brief analysis of the relationship between academia and industry in the Semantic Web. We focus on the set of publications tagged with the topic “Semantic Web” in the 2001-2018 period, which counts 27,480 publications: 25,391 of type A, 1,103 of type I, and 986 of type C. A snapshot of this dataset is available at https://figshare.com/s/33c72312f76023a287b9.
The first interesting insight regards the high rate of collaborations between academia and industry in this field. The ratio of the number of publications produced in collaborative efforts (C) to the ones produced exclusively by the industrial sector (I) is 0.89. This is significantly higher than the C:I ratio in the full dataset (0.14) and in similar research fields such as Artificial Intelligence (0.21), Machine Learning (0.21), and Data Mining (0.25). We hypothesise that the large number of collaborative articles may derive from the fact that the Semantic Web is a relatively new area in term of industrial adoption and thus many persons working in companies come from or work regularly with academia. We plan to further investigate this trend in future work.
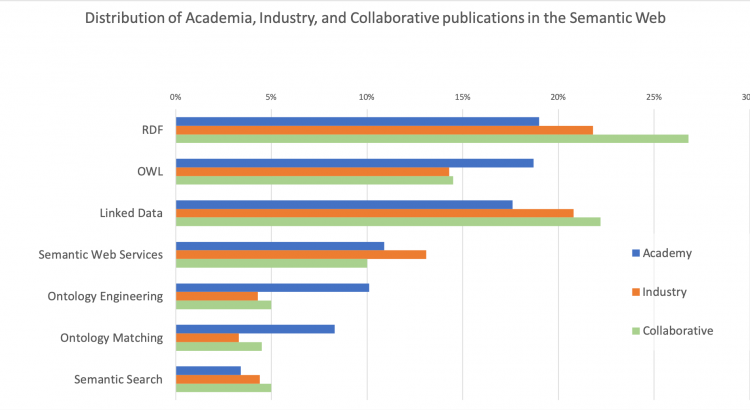
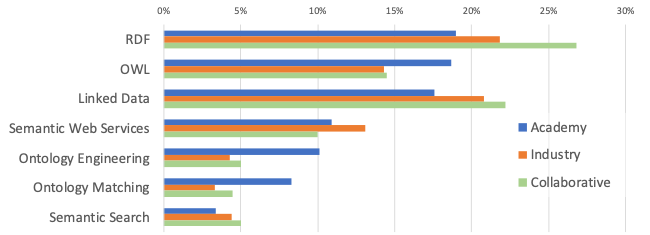
Figure 1 focuses on the main subtopics of Semantic Web and shows for each category the number of publications in a subtopic (e.g., all A papers about Linked Data) normalized with the total number of publications in the category (e.g., all A papers about Semantic Web). Research topics such as RDF, Linked Data, and Semantic Search appears to be relatively more attractive for the industrial sectors. Conversely, Ontology Engineering, Ontology Matching, and OWL seems to be more interesting for academia. However, this view regards the full 2001-2018 period. A diachronic analysis revealed that this scenario is slowly changing, with industry becoming increasingly more interested in these topics over the last five years. For instance, the normalized number of the A and I publications in Ontology Engineering is almost the same after 2013.
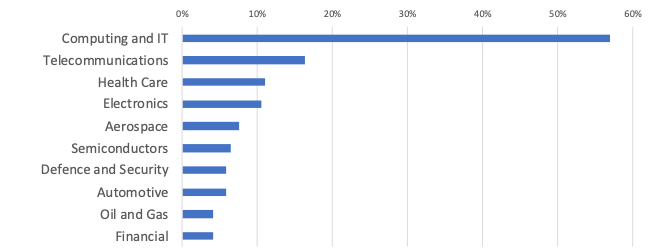
Figure 2 shows the distribution of the types of companies publishing within the Semantic Web domain. The main type is “Computing and IT” (57%) followed by Telecommunications (16%), Health Care (11%), and Electronics (10%). We can also appreciate the marginal but significant presence of company types that would not be traditionally associated with Semantic Web Technologies, such as Aerospace, Semiconductors, Defence and Security, and Automotive. We are currently working on further developing our integration pipeline and releasing a full version of the knowledge graph. We also plan to perform a comprehensive analysis on the relationship between academia and industry, comparing their research outputs in term of topics, research venues, and geographical distribution.
References
- Anderson, M.S.: The Complex Relations between the Academy and Industry. The Journal of Higher Education. 72, 226–246 (2001).
- Weinstein, L.B., Kellar, G.M., Hall, D.C., Ankrah, S., Omar, A.-T.: Universities–industry collaboration: A systematic review. Academy of Educational Leadership Journal. 31, 62 (2016).
- Weinstein, L.B., Kellar, G.M., Hall, D.C.: Comparing Topic Importance Perceptions of Industry and Business School Faculty: Is the Tail Wagging the Dog? Academy of Educational Leadership Journal. 20, 62 (2016).
- Ankrah, S.N., Burgess, T.F., Grimshaw, P., Shaw, N.E.: Asking both university and industry actors about their engagement in knowledge transfer: What single-group studies of motives omit. Technovation. 33, 50–65 (2013).
- Salatino, A.A., Osborne, F., Thanapalasingam, T., Motta, E.: The CSO Classifier: Ontology-Driven Detection of Research Topics in Scholarly Articles. In: TPDL 2019: 23rd International Conference on Theory and Practice of Digital Libraries (2019).
Paper Download
Download from ORO: http://oro.open.ac.uk/66174/
Download from CEUR: http://ceur-ws.org/Vol-2456/paper22.pdf